Website Statistics: Key Highlights
-
Websites age quickly, with an average lifespan of just over two and a half years, reinforcing the need for continuous updates rather than static builds.
-
Poor experiences carry lasting consequences, as 88% of users are unlikely to return after a bad visit and 53% of them abandon mobile sites that load slowly.
-
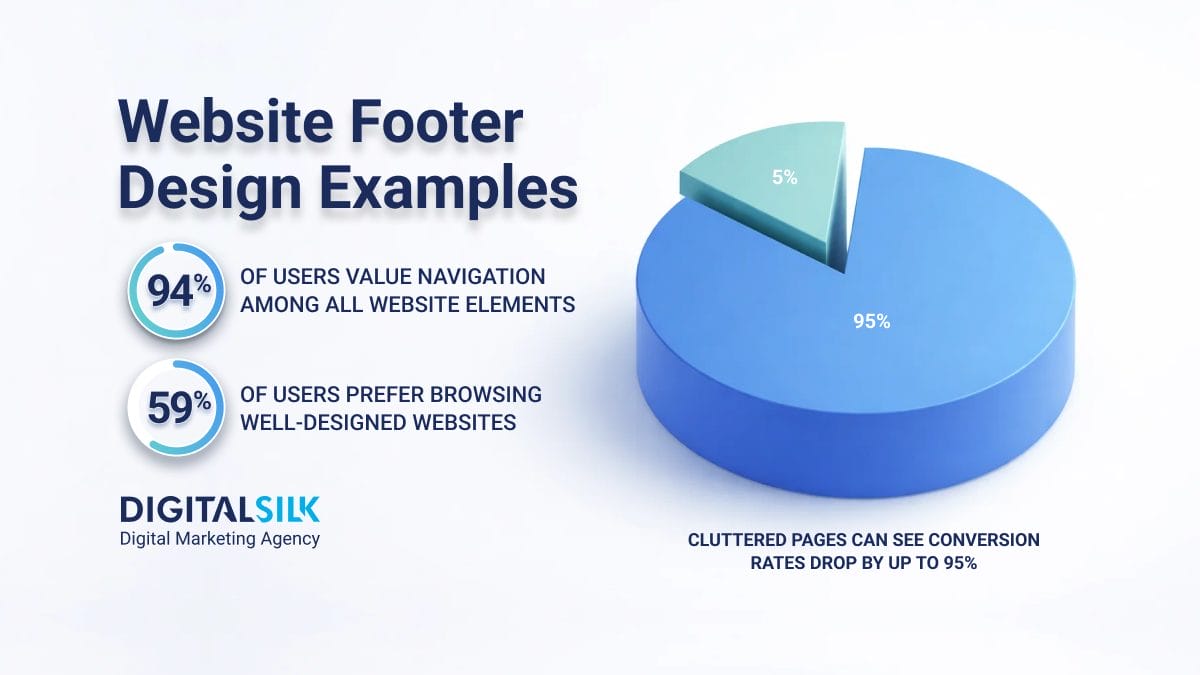
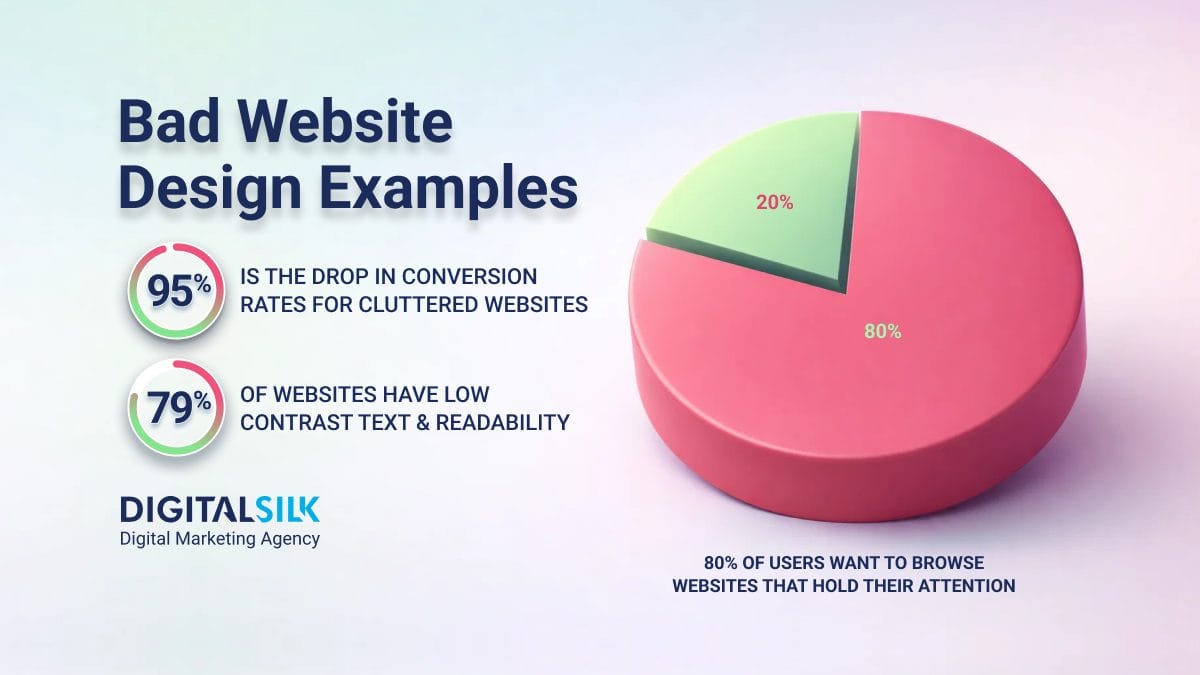
Visual and content overload reduces performance sharply, with cluttered pages cutting conversions by up to 95%.
What do people learn about your business when they search for the relevant products or services and are you the one shaping that narrative?
With 60.7% of adults worldwide using the internet to find information, your website sets expectations before anyone reaches out, asks for a proposal or starts a buying conversation.
High-performing companies treat their site as a commercial asset that answers buyer questions, reflects how the business operates and helps move deals forward.
Let’s take a look at the key stats on websites in 2026 to help you gain a detailed understanding of the latest trends and insights in the industry.
General Website Statistics
Knowing general website statistics can help you predict and improve your website’s performance.
The following stats offer a broad view of the current state of the internet and its usage:
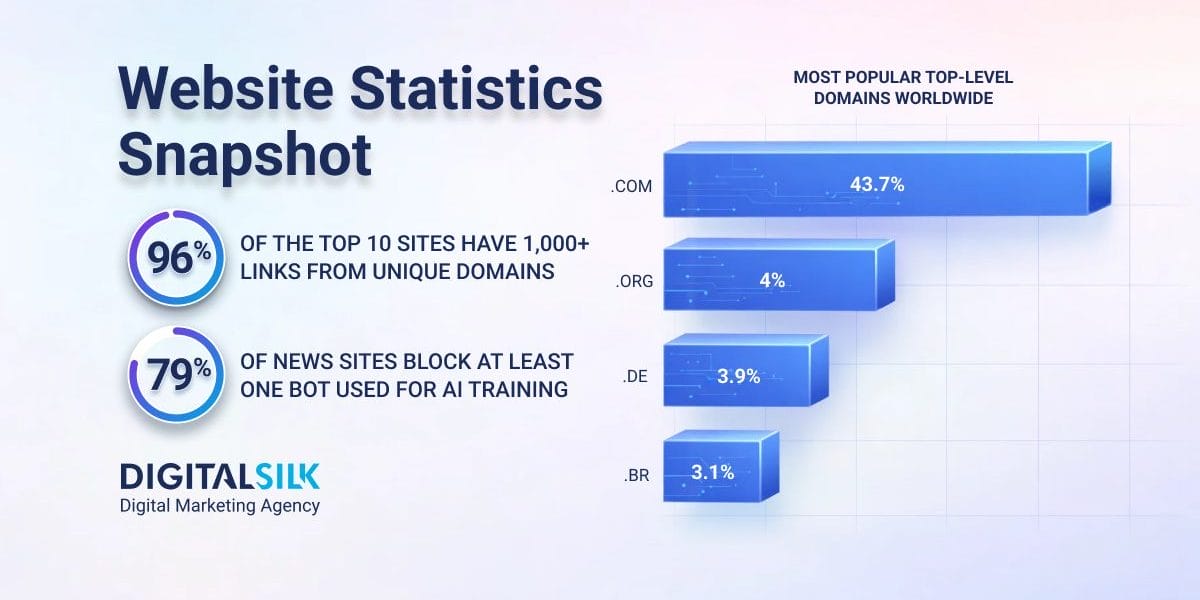
- The .com domain is used by 43.7% of all websites.
- Google receives 98.2 billion monthly visits, which makes it the most popular website worldwide.
- Google also has the highest number of unique visitors globally, with 5.66 billion per month.
- WhatsApp.com records the highest average time per visit at approximately 36 minutes and 51 seconds.
- In December 2025, the total number of websites reached over 1.38 billion across almost 292 million domains.
- English is the most used language for global web content, representing 49.2% of all websites.
- 93% of all internet experiences start with a search engine.
- An average person on the internet visits up to 130 web pages per day, which translates to 910 per week and 4,000 per month.
- On average, users spend 6.38 hours online per day, with the U.S. having a slightly higher number at 6.4 hours.
- About 60% of visitors aged 25 to 34 use chatbots on direct-to-consumer (D2C) websites.
- 45% of consumers in the U.S. say they appreciate that chatbots answer their questions immediately.
- On average, pop-ups only convert 3.09% of viewers, while the most successful ones have a conversion rate of 9.28%.
- The average lifespan for a website is two years and seven months.
What These Numbers Mean For You
These figures show how crowded, fast-moving and expectation-driven the modern web has become, and why surface-level execution no longer holds attention for long.
Planning Implications For Leadership
- Design for discoverability first, differentiation second. With search engines shaping most entry points and billions of sites competing for attention, being easy to find and easy to understand matters more than aesthetic novelty.
- Assume comparison is constant. High daily page consumption means your website is rarely viewed in isolation, so clarity of value and relevance must land immediately or attention moves on.
Execution Tradeoffs To Consider
- Scale creates reach but dilutes focus. Global domains and dominant platforms offer massive exposure, yet they also raise the bar for relevance and speed of comprehension.
- Automation improves responsiveness but shifts expectations. Chatbots can reduce response gaps, but they require thoughtful boundaries to avoid replacing meaningful engagement with shallow answers.
Risks That Can Undermine Performance
- Overestimating tactics with marginal payoff. Low average conversion rates on pop-ups show how easily intrusive elements consume effort without delivering proportional returns.
- Treating a website as a fixed asset. Short site lifespans reflect how quickly relevance erodes when content, structure and messaging fail to evolve alongside user behavior.
Most Popular Websites By Industry
In some industries, certain websites dominate the market in terms of the total number of visitors.
The statistics below can provide insight into consumer preferences and how these websites maintain their leading positions:
- YouTube is the most popular TV, movies and streaming website in the U.S., with a 75.02% share of visits.
- Amazon is the most popular eCommerce store in the U.S., with 73% of users having purchased something from the site in the past 12 months.
- eBay is the most popular second-hand shopping website in the U.S., with two-thirds of U.S. consumers saying they’ve bought something from it once.
- DoorDash is the leading food delivery website in the U.S., with 74% of respondents having used the platform in the past 12 months.
- Zillow is the leading real estate website in the U.S., with 365.8 million monthly visits.
- DraftKings is the most popular fantasy sports website in the U.S., with 9.67 million monthly visitors, followed by FanDuel with 8.64 million.
- The United States is the primary source of ChatGPT‘s website traffic, accounting for 19.42% of total visits.
- Capital One Shopping is the most visited coupon website in the U.S., with 17% of all desktop visits in this category of websites.
- Airbnb is the most popular travel and tourism website in the U.S., making up 4.44% of total traffic.
- Chase is the leading finance website in the U.S., with 4.46% of traffic in the finance sector.
What These Numbers Mean For You
The most visited websites earn repeat traffic by removing hesitation from a single core action users come back for, such as buying, booking, watching or comparing.
Planning Implications For Leadership
- Define your primary user action. The most visited platforms anchor themselves to a single, repeatable action and build everything else around that habit.
- Study dominant platforms outside your industry. Patterns from commerce, media and finance show how trust and familiarity scale when effort is reduced at moments that matter most.
Execution Tradeoffs To Consider
- Depth often beats breadth. Platforms that concentrate on a narrow set of actions create stronger repeat usage, but this focus can limit flexibility as expectations change.
- Standardization improves adoption but reduces experimentation. Familiar layouts and flows shorten learning curves, yet they can slow evolution if left untouched for too long.
Risks That Can Undermine Performance
- Competing head-on with established platforms. Replicating market leaders without a distinct angle can consume budget and attention without changing user behavior.
- Ignoring why users return. High traffic can hide the underlying drivers of loyalty, and missing those signals leads to investments that look competitive but fail to build preference.
International Website Statistics
The statistics we provided above concern website traffic in the U.S.
Now let’s check out which sites receive the most traffic in other countries:
- Google generates 102 million unique visitors in Canada, with YouTube taking second place with 61.2 million.
- Google is the most visited website in India, with 9.11 billion monthly visits.
- With 381.07 million monthly visits, Bing is the most visited website in China.
- Naver is the most visited website in South Korea, with 23.59 million unique monthly visitors.
- Google takes the top spot in Russia, with over 5.06 billion monthly visits, while Yandex comes in second with 3.48 billion.
What These Numbers Mean For You
Global traffic patterns reveal that search behaviour, platform trust, and entry points vary significantly by market and assumptions that work domestically often break down abroad.
Planning Implications For Leadership
- Localize your discovery strategy, not just content. Market leaders differ by country, so visibility depends on aligning with how audiences actually search, navigate and prioritize information in each region.
- Audit reliance on a single traffic source. Heavy dependence on one platform limits reach in markets where alternatives dominate daily usage.
Execution Tradeoffs To Consider
- Regional alignment adds complexity. Supporting different platforms, search engines and user expectations increases operational effort but improves relevance and reach.
- Standard global builds move faster. Uniform experiences simplify rollout, yet they risk underperforming where user behavior follows different patterns.
Risks That Can Undermine Performance
- Assuming global search works the same everywhere. Strategies built around a single dominant engine can overlook entire audiences in markets with strong local players.
- Overlooking regional trust signals. Familiar platforms carry built-in credibility and ignoring them can slow adoption even when the product offering is competitive.
Website User Experience Statistics
User experience is one of the key elements to consider when designing a website, as it ensures visitors can easily navigate a website and find what they need.
Take a look at some statistics that demonstrate how speed, design and functionality impact user interaction with websites:
- An average user takes 0.05 seconds to form an opinion about a website.
- If a mobile website takes more than 3 seconds to load, 53% of users will abandon it.
- 88% of online consumers are less inclined to revisit a website after a poor experience.
- Approximately 94.8% of website home pages have accessibility failures.
- 17% of website visitors in the U.S. abandon their orders due to site errors or crashes.
What These Numbers Mean For You
User experience shapes perception faster than any message you publish and small execution gaps can carry long-term revenue consequences.
Planning Implications For Leadership
- Prioritize initial load and layout. Speed, structure and visual order matter most in the first moments before users scroll or interact.
- Treat accessibility as a baseline expectation. Gaps in accessibility signal operational blind spots and can quietly exclude qualified buyers from engaging further.
Execution Tradeoffs To Consider
- Feature density increases risk. More functionality creates more failure points, which can slow pages and introduce errors during high-intent moments.
- Performance investments shift timelines. Improving speed and stability may delay new releases, but it protects retention and conversion over time.
Risks That Can Undermine Performance
- Normalizing technical errors. Crashes and broken flows erode trust quickly, especially when users are ready to transact.
- Underestimating first impressions. Early friction reduces the likelihood of return visits, regardless of product quality or brand reputation.
Website Ranking Statistics
How a website ranks on search engines is crucial to its visibility and long-term brand perception.
Below, we’ve listed the key stats on search engine results and the websites that have secured top positions:
- With an 86.71% market share, Google is the top search engine in the United States.
- Only 40% of websites rank on the first page in search engine results pages (SERPs).
- By 2028, an estimated 36 million adults in the United States are expected to use generative AI as their primary tool for online search.
- 79% of news sites block at least one bot used for AI training to prevent their data from being used in model development.
- 96% of websites that rank in the top 10 on Google have over 1,000 links from unique domains.
- The no. 1 ranking page in SERPs receives an additional 5%-4.5% do-follow backlinks from new sites.
What These Numbers Mean For You
Search results increasingly reward pages that have earned sustained trust over time, while new discovery behaviors introduce additional expectations around how information is structured and surfaced.
Planning Implications For Leadership
- Invest in long-term credibility signals. Pages that hold top positions tend to accumulate references, citations and recognition steadily rather than through isolated optimization efforts.
- Plan for multiple entry points to discovery. Traditional search remains dominant, but AI-driven tools favor content that is clearly organized, well-sourced and easy to interpret.
Execution Tradeoffs To Consider
- Link growth requires patience. Building references from independent, reputable sites takes longer than tactical campaigns, yet it supports visibility that is harder to displace.
- Managing crawler access shapes exposure. Limiting AI bots protects content control, while broader access increases the chances of appearing in emerging search experiences.
Risks That Can Undermine Performance
- Focusing on rank without authority. Pages that reach the first page without strong backing often lose ground as competition intensifies.
- Missing the visibility flywheel. Well-ranked pages attract more references by virtue of being seen, and delaying investment makes that gap harder to close.
Website Traffic Statistics
Nothing indicates the success of a website like its traffic and engagement metrics.
The stats we singled out highlight what engages the users and what pushes them away from websites:
- 50.39% of global website traffic comes from mobile devices, highlighting the widespread reliance on smartphones for online access.
- In contrast, desktop usage dominates in the U.S., accounting for 56.13% of website traffic.
- The average time a new visitor spends on a website is 2.7 minutes, while a returning visitor tends to browse longer, at 3.7 minutes.
- Returning visitors browse 4.9 pages per visit, outperforming new visitors at 4.1 pages on average.
- The average conversion rate stands at 2.47%, with desktop clearly outperforming mobile devices.
- Websites that deepened the user journey by increasing page visits saw conversion rates rise by 5.4%, while those with lower session depth experienced a 13.1% decline in 2025.
- 40.1% of website sessions include at least one frustration factor for users, with JavaScript errors being the most common at 18.8%.
- The average bounce rate on mobile stands at 49.1%, which is higher than the 47.3% recorded on desktop.
- An average user spends 88% more time on a website with video content.
- Cluttered pages see conversion rates drop by up to 95%.
- Publishing over 16 blog posts per month can increase website visits 3.5 times.
What These Numbers Mean For You
Traffic patterns reveal clear gaps between device behavior, visitor intent and how depth of engagement directly affects conversion potential.
Planning Implications For Leadership
- Treat mobile and desktop as distinct experiences. Differences in engagement and conversion indicate that a single design logic rarely serves both contexts equally well.
- Optimize for return visits, not just first clicks. Returning users spend more time, explore more pages and signal higher intent, making retention-focused improvements a direct growth lever.
Execution Tradeoffs To Consider
- Richer journeys require better quality control. Adding depth through content, video and internal paths can lift performance, but it increases exposure to errors that disrupt sessions.
- Publishing velocity affects focus. Frequent content can drive traffic momentum, yet it demands discipline to avoid clutter that erodes usability and conversion.
Risks That Can Undermine Performance
- Technical errors interrupt buying behavior. Broken scripts and unstable pages disrupt sessions, which reduces completed actions and repeat visits.
- Overloading pages in pursuit of engagement. Visual and content density can backfire quickly, turning attention into drop-offs rather than progress through the site.
Create Your Website With Digital Silk
If you’re launching a new website, understanding these key statistics about websites empowers you to make informed decisions.
A professionally designed and well-optimized website enhances your credibility, strengthens customer connections and drives sales.
Digital Silk‘s experts can help you create a website that drives traffic, engages users and leads to more conversions.
As a recognized web design agency, some of the services we offer include:
- Custom web design
- Custom web development
- eCommerce web development
- Shopify web design and development
- Branding services
- Digital marketing
Contact our team, call us at (800) 206-9413 or fill in the Request a Quote form below to schedule a free, custom consultation.
"*" indicates required fields


