If you’re an online retailer or you plan to start an eCommerce business, paying attention to key online shopping statistics can help you better understand customer behavior and stay ahead of trends.
As more people turn to online shopping, these insights can inform everything from product selection to the security measures your business adopts, ultimately enhancing the shopping experience on your website.
How many people shop online? What do they buy the most? And who shops online the most?
In this article, we’ll provide answers to these important questions along with more crucial statistics relevant to your online retail business.
General Online Shopping Statistics
Let’s begin by looking at some key figures that showcase how big the online shopping market actually is and better highlight user behavior:
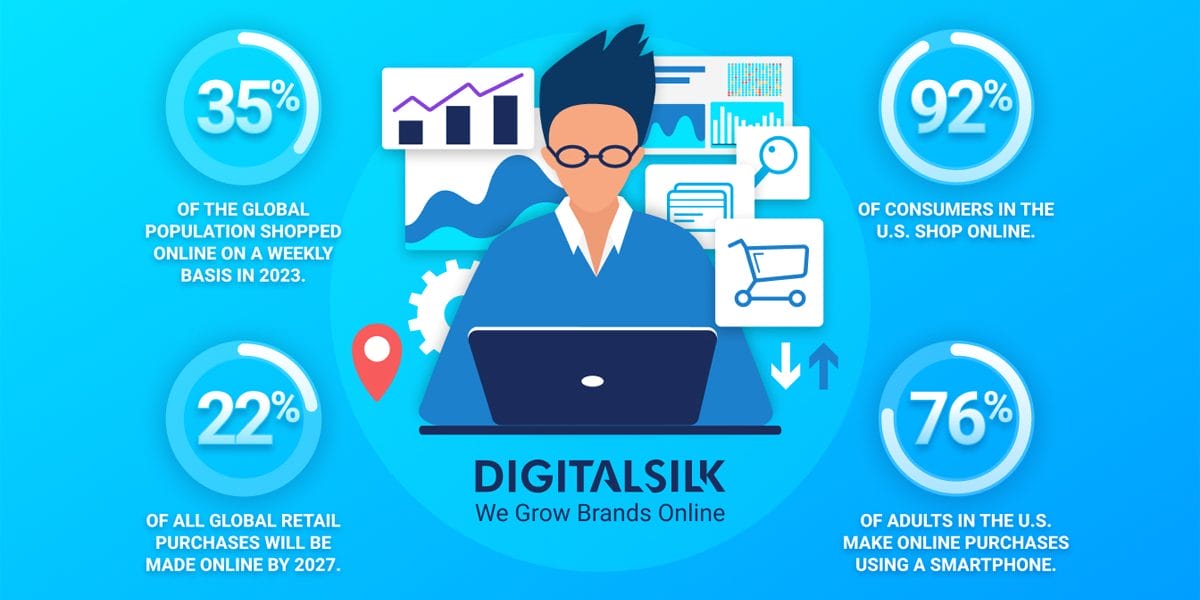
- 35% of the global population shopped online on a weekly basis in 2023.
- 22.6% of all global retail purchases will be made online by 2027.
- 92% of consumers in the U.S. shop online.
- The number of consumers in the U.S. shopping online is expected to increase by 60 million between 2024 and 2029.
- 43% of consumers in the U.S. say they prefer shopping online rather than in-store, making it the country with the highest online shopping preference.
- Only 33% of global consumers shop in brick-and-mortar stores without any digital aids.
- 48% of online shoppers in the U.S. said free delivery is the main reason they shop on Amazon.
- Clothing is the most popular category for online purchases in the U.S., with 43% of respondents saying they’ve ordered clothes online in the past 12 twelve months.
- 63% of global consumers said they’ve purchased products directly from a brand’s site.
- The global online shopping cart abandonment rate was 70.19% in 2023.
- In the U.S., the grocery delivery eCommerce revenue is projected to exceed $422 billion by 2028.
- 48% of consumers cite additional costs, such as extra shipping fees, as the top reason for abandoning their shopping carts.
- 76% of consumers in the U.S. want the ability to use their preferred payment method when shopping online.
- 49% of online shoppers use digital wallets to pay for products they order.
- 3% of consumers in the U.S. said they shopped online for the first time during the COVID-19 pandemic.
- 52% of online shoppers worldwide look for products internationally.
- 42.6% of online shoppers cite shipments being delayed in customs as the biggest challenge when shopping online internationally.
- Clothing and footwear are the most popular shopping category to order from abroad, with 39% of respondents saying they’ve purchased these items across borders and online.
- 83% of shoppers conduct online research before they head to physical stores.
- 35% of people say online marketplaces are their leading source of inspiration when shopping online.
- Black Friday shoppers spent a record $9.6 billion online in 2023.
- The revenue from Cyber Monday in the U.S. was projected to be $12 billion in 2023.
- Consumers in the U.S. spent a record $222.1 billion online during the 2023 holiday shopping season (November 1 – December 31).
- Adobe predicts online shoppers will spend a record $240.8 billion during the 2024 holiday season (November 1 to December 31).
- As of June 2024, there are 904 million online shoppers in China.
Online Shopping Demographics
Different generations have their own distinct shopping behaviors and preferences. Let’s look at the key demographics of online shoppers and how each generation shops on the web:
- 57% of global Gen Z consumers shop for clothing and shoes online.
- 50% of Gen Z compare prices on Amazon before placing an order.
- 65% of millennials in the U.S. shopped for groceries online in 2023.
- 64% of millennials in the U.S. said they prefer to shop for leisure, sports and hobby products online.
- 67% of millennials and 66% of Gen Z are ready to wait for discounts before making an online purchase.
- Gen Z are most likely to buy used items online, with 42% saying they engaged in secondhand shopping in Q1 of 2023.
- 75% of baby boomers in the U.S. shop online at least once a month.
Mobile Online Shopping Statistics
The key website statistics show that mobile devices now account for over half of all website traffic. Many online shoppers use them to browse, compare and eventually purchase products online.
Therefore, it’s crucial for online retailers to optimize their sites for mobile use and cater to this growing demand.
The mobile online shopping stats below demonstrate this:
- 76% of adults in the U.S. make online purchases using a smartphone.
- People aged 18-24 shop online from mobile the most in the U.S., making up 46.9% of the online shopping audience.
- 96% of Gen Z consumers in the U.S. have made at least one purchase each month in 2023.
- 60% of adults in the U.S. believe mobile shopping is a necessity for shopping convenience.
- 74% of consumers are more likely to return to an online store if it’s optimized for mobile devices.
- Temu emerged as the leading shopping app in the U.S., with 122.5 million downloads in 2023.
- The global cart abandonment rate on mobile devices is 84%.
Social Shopping Statistics
Social media platforms have reshaped the ways people shop online. Now, users can scroll through Facebook, Instagram or TikTok and purchase anything they come across without leaving the app.
Let’s look at how consumers interact with social commerce and how these platforms influence their purchasing decisions:
- Social sales accounted for an estimated 18.5% of all global online sales in 2023.
- In 2023, the number of social buyers in the U.S. was estimated to be 106.8 million.
- The revenue from social commerce in the U.S. is projected to reach $141.4 billion by 2028.
- 58% of shoppers in the U.S. said they’ve purchased a product after discovering it on social media.
- Facebook is projected to have over 69 million social buyers by 2025, while Instagram is expected to reach 47 million.
- Almost 70% of Gen Z shoppers are likely to make a purchase through TikTok.
Online Shopping Security Statistics
Cybersecurity is one of the biggest challenges in eCommerce, with online stores being common targets in cyber attacks.
These stats highlight what aspects of security consumers value the most when shopping online and how cybercriminals target online shopping websites:
- 92% of consumers in the U.S. said security is very important for them when shopping online.
- 73% of consumers in the U.S. cite payment security as a top priority when shopping online.
- 82% of online shoppers in the U.S. are more ready to shop on websites that openly discuss their efforts to prevent fraud.
- Online shopping brands are targeted in 41.65% of all financial phishing attempts.
- Cybercriminals impersonated Amazon in 34% of all online financial phishing attacks in 2023. Apple is second, with 18.66% of all fraudulent pages impersonating the popular tech brand.
Design Your eCommerce Store With Digital Silk
The statistics and facts about online shopping we listed in this article show that more people are shopping online and consumer behavior continues to evolve.
By leveraging these statistics, online retailers can make more informed decisions to optimize their strategies and better meet the demands of digital shoppers.
If you have an eCommerce project in mind, Digital Silk can help you turn your ideas into reality. We offer eCommerce web design and development services and deliver measurable results.
Other services Digital Silk offers include:
- Custom web design
- Custom web development
- Shopify web design & development
- Magento web design & development
- WooCommerce development
Contact us, call us at (800) 206-9413 or fill out the Request a Quote form below to book your free consultation with one of our experts and discuss your project.
"*" indicates required fields


