Comparing mobile vs. desktop traffic share offers valuable insights into how users access the internet and interact with the websites they visit.
Different regions show varying preferences, revealing a lot about user behavior and online engagement.
We’ll explore how mobile and desktop usage trends differ across the globe and examine how much traffic some of the biggest websites in the world receive from both types of devices.
Mobile Vs. Desktop Traffic Share
With over 5.44 billion people online and around 1.1 billion websites, the ways we interact with the World Wide Web is constantly changing.
The number of mobile users is steadily increasing, overtaking desktop users in many countries.
The latest data provides a detailed breakdown of traffic share between mobile and desktop devices globally and in specific regions:
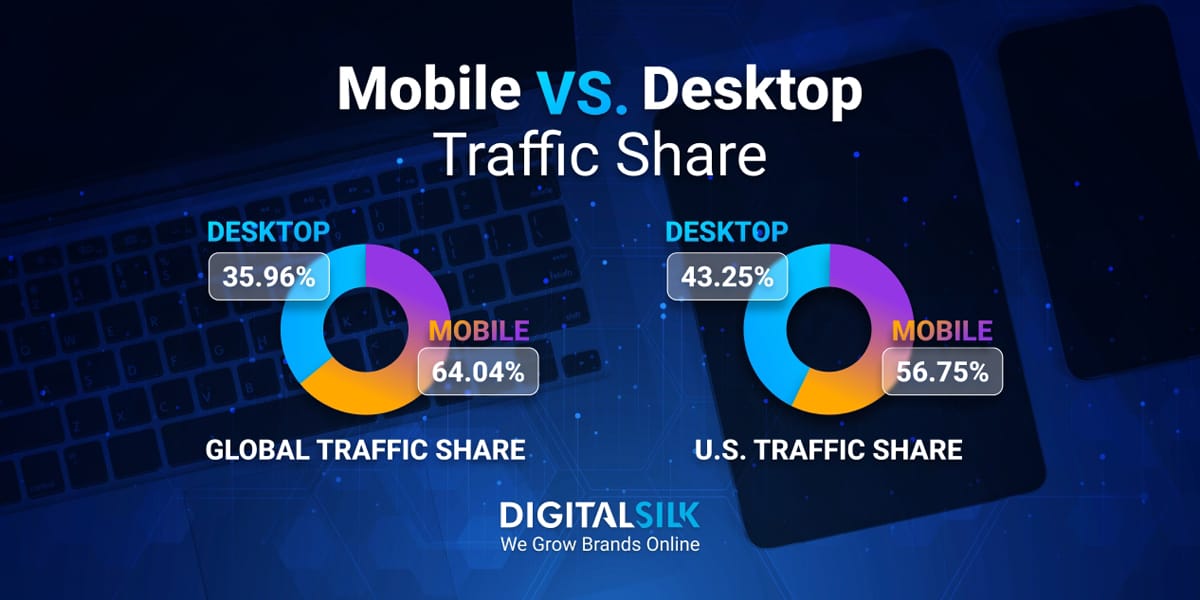
- As of November 2024, 64.04% of all internet traffic comes from mobile devices, while 35.96% comes from desktop.
- In the U.S., the distribution is more balanced, with mobile devices responsible for 56.75% of web traffic and desktops at 43.25%.
- 15% of adults in the U.S. only use mobile devices to access the internet.
- Japan is one of the countries with a higher preference for desktop browsing at 55.77%, while 44.23% comes from mobile devices.
- The situation is somewhat similar in Canada with 51.55% of traffic coming from desktops and 48.45% from mobile devices.
- In the U.K. mobile devices account for 56.86% of all internet traffic while desktops account for 43.14%.
- Internet users in the U.K. spend around 3.28 hours a day accessing the web from their smartphone and 1.13 hours accessing it from their PC or laptop.
- In India, 80.31% of all internet traffic comes from mobile devices while 19.69% comes from desktops.
- In China, mobile devices account for 66.06% of all internet traffic while desktops contribute to 33.94% of it.
- Sudan is the country with the highest preference for mobile internet use with 94.7% of traffic and only 5.22% of traffic coming from desktops.
- Nigeria also has an extremely high preference for mobile internet use, with 85.57% and only 14.43% of internet traffic coming from desktops.
- 20% of Americans use smartphones for media and entertainment, while 8% use a laptop or PC. Television and smart/connected TV still lead the way with 33% and 30%, respectively.
- 70.1% of internet users worldwide play video games on their smartphones. 35.8% play on their laptop or desktop.
- 54% of 7,000 surveyed Americans said they prefer playing games on their smartphones. PC and laptop came in third place with 32% of surveyed participants.
- 67% of all health and beauty retail website orders come from mobile devices. 18% come from desktops, while 1% come from tablets.
- Of 8,845 surveyed consumers, 69% said they use smartphones to stream digital videos. Only 25% of respondents said they use desktop devices.
- 79% of adults aged 18-34 said they watch video content weekly on their smartphones and 37% they watch it weekly on their computer or laptop.
- A 2024 survey showed that 78% of podcast listening time in the U.K. came through smartphones. Laptops were selected as the second most used device with 11% of podcast listening time.
- In 2025, mobile computers will generate 2.75 exabytes of mobile data traffic every month.
- In 2013, 72.6% of all internet traffic came from desktops, while only 27.4% came from mobile devices.
Desktop Users Vs. Mobile Users On Major Websites
The growing use of mobile internet browsing has also influenced the ways users interact with some of the biggest websites and platforms on the internet.
The data we gathered explores the differences in traffic between mobile and desktop users on these sites and reveals trends in user behavior.
- Reddit receives 5.9 billion visitors from mobile devices, compared to 1.67 billion from desktop devices.
- ChatGPT has 1,170.27 million monthly visits from mobile devices, while 1,124.95 million monthly visits come from desktops.
- Ebay has 327.36 million monthly visits from mobile devices, while it gets 308.69 million monthly visits from desktops.
- For YouTube, 87.35% of all visits are made from mobile devices, while 12.65% come from desktops.
- 76.86% of all traffic to Wikipedia originates from mobile devices, while only 23.14% comes from desktops.
Mobile Vs. Desktop Ownership Statistics
Now that we’ve explored how many users browse the web using mobile and desktop devices, let’s take a look at how many people own these devices:
- 96.2% of households in the U.S. have at least one computer.
- 91% of Americans own a smartphone, while 98% have a cellphone.
- 4.3 billion people in the world, or 53% of the global population owns a smartphone.
- The global personal computer market size will reach $267.71 billion by 2028.
- The volume of the tablet market will reach 195.3 million pieces by 2029.
Grow Your Website With Digital Silk
The latest mobile vs. desktop internet usage statistics show that the preference for mobile devices is constantly growing. However, in some regions, users still favor desktops.
As the user behavior continues to evolve, it’s important to optimize your designs for both mobile and desktop platforms while ensuring fast load times across all devices.
To do this effectively, consider partnering with Digital Silk, an end-to-end web design agency that helps brands enhance their online presence.
Whether you need to improve your desktop performance or develop a mobile-first website, we can provide tailored solutions that meet your specific needs.
Other services Digital Silk offers include:
- Custom web design
- Custom web development
- eCommerce web design and development
- Shopify web development
- Magento web development
- WooCommerce web development
If you have a project in mind, you can contact us, reach out via (800) 206-9413 or use the Request a quote form below to book your free, custom consultation.
"*" indicates required fields


