PPC Statistics: Key Highlights
-
Paid search spend will hit $351.5 billion in 2025, but rising costs and privacy rules mean bigger budgets don’t guarantee better ROI.
-
Google’s U.S. share may fall below 50% as Amazon grabs 22.3% — smart brands are shifting 10–15% of spend to TikTok Search, AI tools and full-funnel tests.
-
Rising CPCs and GA4 attribution are changing how ROI is tracked — aligning KPIs with finance now is key to staying profitable.
Pay-per-click (PPC) advertising is one of the most measurable and controllable ways to reach potential customers online.
Companies continue to increase their budgets with search ads spending in the U.S. alone projected to reach $140.06 billion in 2025.
For companies investing heavily in paid search and display ads, staying informed about current PPC statistics is key to making smart, profitable decisions.
The numbers reveal what’s driving performance, where opportunities lie and how top campaigns are achieving strong results.
Let’s take a closer look at the most important trends and figures shaping the world of PPC advertising.
General PPC Statistics
Pay-per-click advertising continues to evolve, with businesses refining their strategies to stay competitive.
From budget allocation to campaign goals, the way companies approach PPC is shaped by shifting technologies, changing consumer behavior and performance data.
Whether it’s leveraging AI tools or fine-tuning keyword targeting, advertisers are constantly looking for ways to maximize returns.
Recent PPC statistics provide a clear insight into the current trends and practices shaping the industry today:
- Global ad spending in the search advertising market is projected to reach $351.55 billion in 2025.
- 55% of companies hire agencies to manage their PPC campaigns.
- In 2024, 72% of digital advertisers stated that the primary objective of their PPC campaigns was achieving efficient growth.
- Paid search ads have an average bounce rate of 43.9%.
- 42% PPC marketers said they always target exact match keywords.
- 75% of PPC professionals say they use AI at least sometimes to write their ads.
- 71% of PPC professionals who use AI say they’re satisfied with the results.
- 52% of B2B PPC ads lead to their homepage instead of a landing page.
- Dedicated PPC landing pages convert 65% better than website pages.
What The Numbers Mean For You
- Budget gravity is real. With global search spend cresting $350 billion, CPC inflation will continue; lock in quarterly efficiency targets (CPC ↓ 3–5%, ROAS ↑ 10%) rather than annual ones.
- Talent strategy matters. More than half of brands now outsource PPC; decide whether your edge will come from best‑in‑class partners or in‑house data science.
- AI is no longer optional. Three‑quarters of practitioners use generative AI — if your team isn’t, you’re paying a 5‑10% “innovation tax” in lost efficiency.
- Landing pages = leverage. A 65% conversion lift from dedicated pages means every $1 million shifted from homepage traffic to purpose‑built pages can unlock $650,000 in incremental pipeline.
Social Media PPC Statistics
With billions of active users across various networks, businesses are using social media to drive engagement, boost visibility and generate leads.
Many consumers now use social apps as search engines. For example, 61% turn to Instagram to discover new products.
As a result, social media has grown into a powerful force in the world of PPC advertising.
Below, we look at how businesses are using social media and allocating their PPC budgets across the most popular platforms:
- 76% of companies use Facebook in their PPC efforts.
- 70% of companies use Instagram in their PPC efforts.
- In 2024, 41% of PPC marketers said they plan to increase their TikTok ads budget.
- In 2024, 34% of PPC marketers planned to increase their LinkedIn ads budget.
- In 2024, 35% of PPC marketers said they plan to increase their X ads budget.
What The Numbers Mean For You
- Platform mix is your new moat. Facebook and Instagram remain reach kings, but TikTok and LinkedIn are the growth stories. Budget 15–20% for TikTok tests now — before CPMs triple.
- Intent tiers drive ROI. Treat Instagram as “product discovery,” LinkedIn as “thought‑leadership nurture” and TikTok as “upper‑funnel scale.” Measure success with tier‑specific KPIs, not a single CPA target.
- Creative velocity beats spend velocity. Social algorithms reward fresh assets; plan for weekly creative drops to keep CPMs flat.
- Executive KPI to watch: Incremental reach per $1,000. If your incremental reach on new platforms is <70 % of Meta’s, re‑balance budgets quarterly.
Mobile PPC Statistics
With more people relying on their phones for everything from shopping to searching, mobile has become a key channel for advertisers.
Brands are optimizing their campaigns to meet consumers where they spend the majority of their time — on their mobile devices.
As mobile habits continue to shape online behavior, understanding their impact on PPC performance is more important than ever.
The statistics below offer a clear view of mobile’s growing role in paid advertising:
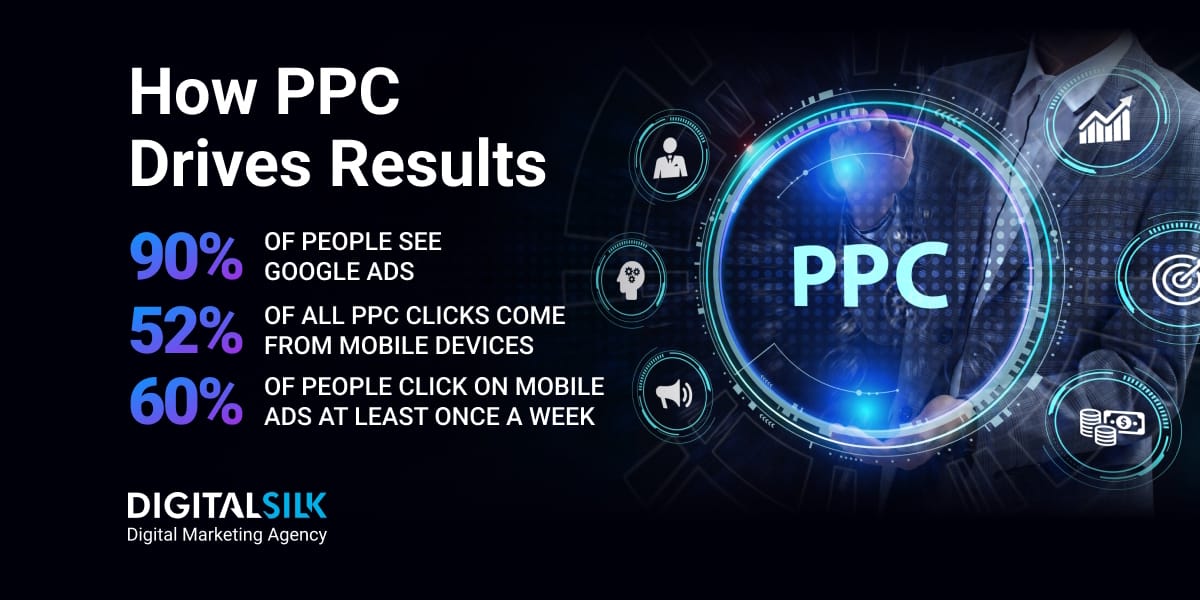
- 52% of clicks on PPC ads are generated through mobile devices.
- 60% of people click on mobile ads at least once a week.
- Mobile devices are responsible for 70% of search ad impressions in the U.S.
- 496 million mobile users have ad blockers installed, which impacts the effectiveness of PPC advertising.
- Mobile ad spending in the U.S. is projected to reach $228.12 billion in 2025.
What The Numbers Mean For You
- Mobile is the default, not a segment. With 70% of search impressions and 52% of clicks on phones, design campaigns mobile‑first—desktop gets the leftovers.
- Speed is money. Each 0.1‑second improvement in mobile load time lifts conversion rates 8–10%. Task engineering to shave 300ms from top landing pages this quarter.
- Ad‑block reality check. Half a billion users never see your ads. Hedge with in‑app inventory and privacy‑safe first‑party data partnerships.
- Executive KPI to watch: Mobile ROAS vs. Desktop ROAS. If the delta exceeds 25%, mandate a CRO audit focused on mobile UX and payment flow.
Platform-Specific PPC Statistics
When it comes to PPC advertising, the choice of platform can significantly impact both performance and budget.
Google Ads and Bing Ads are two of the most widely used search advertising platforms, each offering unique advantages depending on the target audience and industry.
In addition to these, platforms like Amazon are increasingly capturing a growing share of the search ad market.
The following paid ad stats break down how advertisers are using these platforms and the results they’re achieving:
- Google was projected to capture about 50.5% of all search ad spending in the U.S. in 2024.
- 90% of people see Google Ads.
- Across all industries, the average click-through rate (CTR) for Google Ads is 3.17%.
- The average CTR for Google display ads is 0.46%.
- 98% of PPC marketers use Google Ads.
- By 2026, over 70% of spending on traditional search ads will go to Google.
- Amazon’s share of the overall search ad spending in the U.S. is 22.3%.
- The average cost per click for search ads across multiple industries on Amazon is $1.50.
- Search ad cost-per-click for Google and Meta Ads has increased for 86% industries in 2024.
- Across all industries, the average cost-per-click (CPC) on Bing is $1.54.
What The Numbers Mean For You
- Diversify or overpay. Google Ads still deliver scale, but CPCs rose in 86% of industries last year. Shifting even 10% of search spend to Amazon or Bing can cut blended CPCs 8–12%.
- Retail media is the fastest‑growing profit center. Amazon’s 22% share isn’t just a threat — it’s a data‑rich opportunity. Carve out a test budget equal to 8–12% of current Google spend.
- Intent‑aligned bidding wins. Use higher bids on Google for high‑intent queries, reserve lower‑intent or product queries for Amazon/Bing to preserve margin.
- Executive KPI to watch: Cross‑platform incremental revenue. Review monthly; if Google’s marginal CPA is 1.4× higher than Amazon’s, re‑allocate immediately.
Create A Comprehensive Digital Advertising Strategy With Digital Silk
The PPC statistics we listed in this article show that this type of advertising remains one of the most effective ways to drive targeted traffic, generate leads and boost ROI — when done right.
Digital Silk is a digital marketing agency that can help you plan, launch and optimize your campaigns to increase lead generation, conversions and brand awareness.
The services we offer include:
Our experts take full project ownership in each project and offer timely and transparent updates and guarantee measurable results.
Contact our team online, call us at (800) 206-9413 or fill in the Request a Quote form below to schedule a consultation.
"*" indicates required fields


